Long-Term Trend:
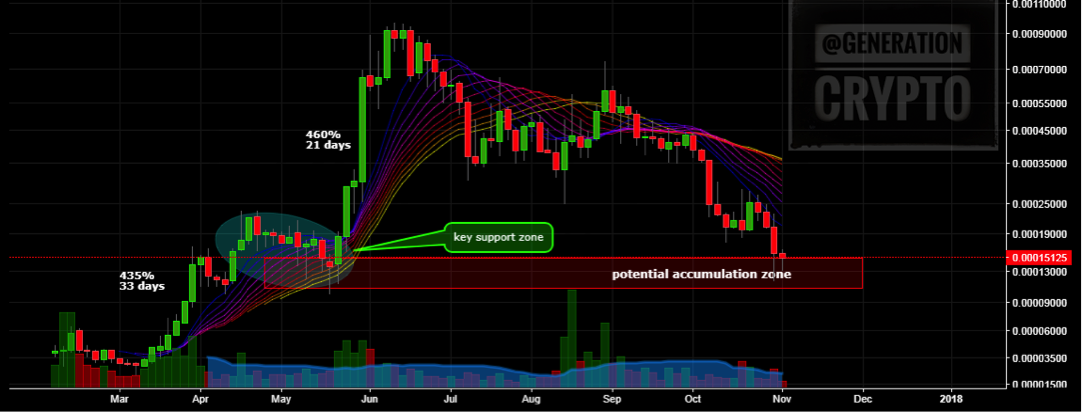
3 day chart shows UBQ at a crucial support price level.
Since UBQ’s last bullish price surge the token has been in a bear market for 117 days.

Volatility:
Bull runs:
UBQ’s Bull runs by number of days and percent gain, starting with most recent:
21 days, 460%
33 days, 435%
Cycles:
UBIQ appears to be at in a bear cycle, RSI is in the oversold range and hasn’t shown recovery or an imminent uptrend.
A close inspection of the daily chart shows a possible incoming 60% bounce, but that’s not indicative of a reversal, absent a major catalyst.
Upcoming Consolidation:
As disclosed above, there is potential for a 60% rise in UBQ’s price, but that move isn’t indicative of a reversal.
Hence we’d like to see UBQ trade sideways for a sustainable period at the current consolidation level.
The upcoming bounce in relation to RSI and previous UBQ movements is highlighted in blue on the following chart.

Recommendation:
UBQ is not ready for entry and needs to be monitored at these levels before making entries or accumulating for a long position.
Download the full report here


