Monero; XMR Technical Analysis Report
Long-Term Trend:
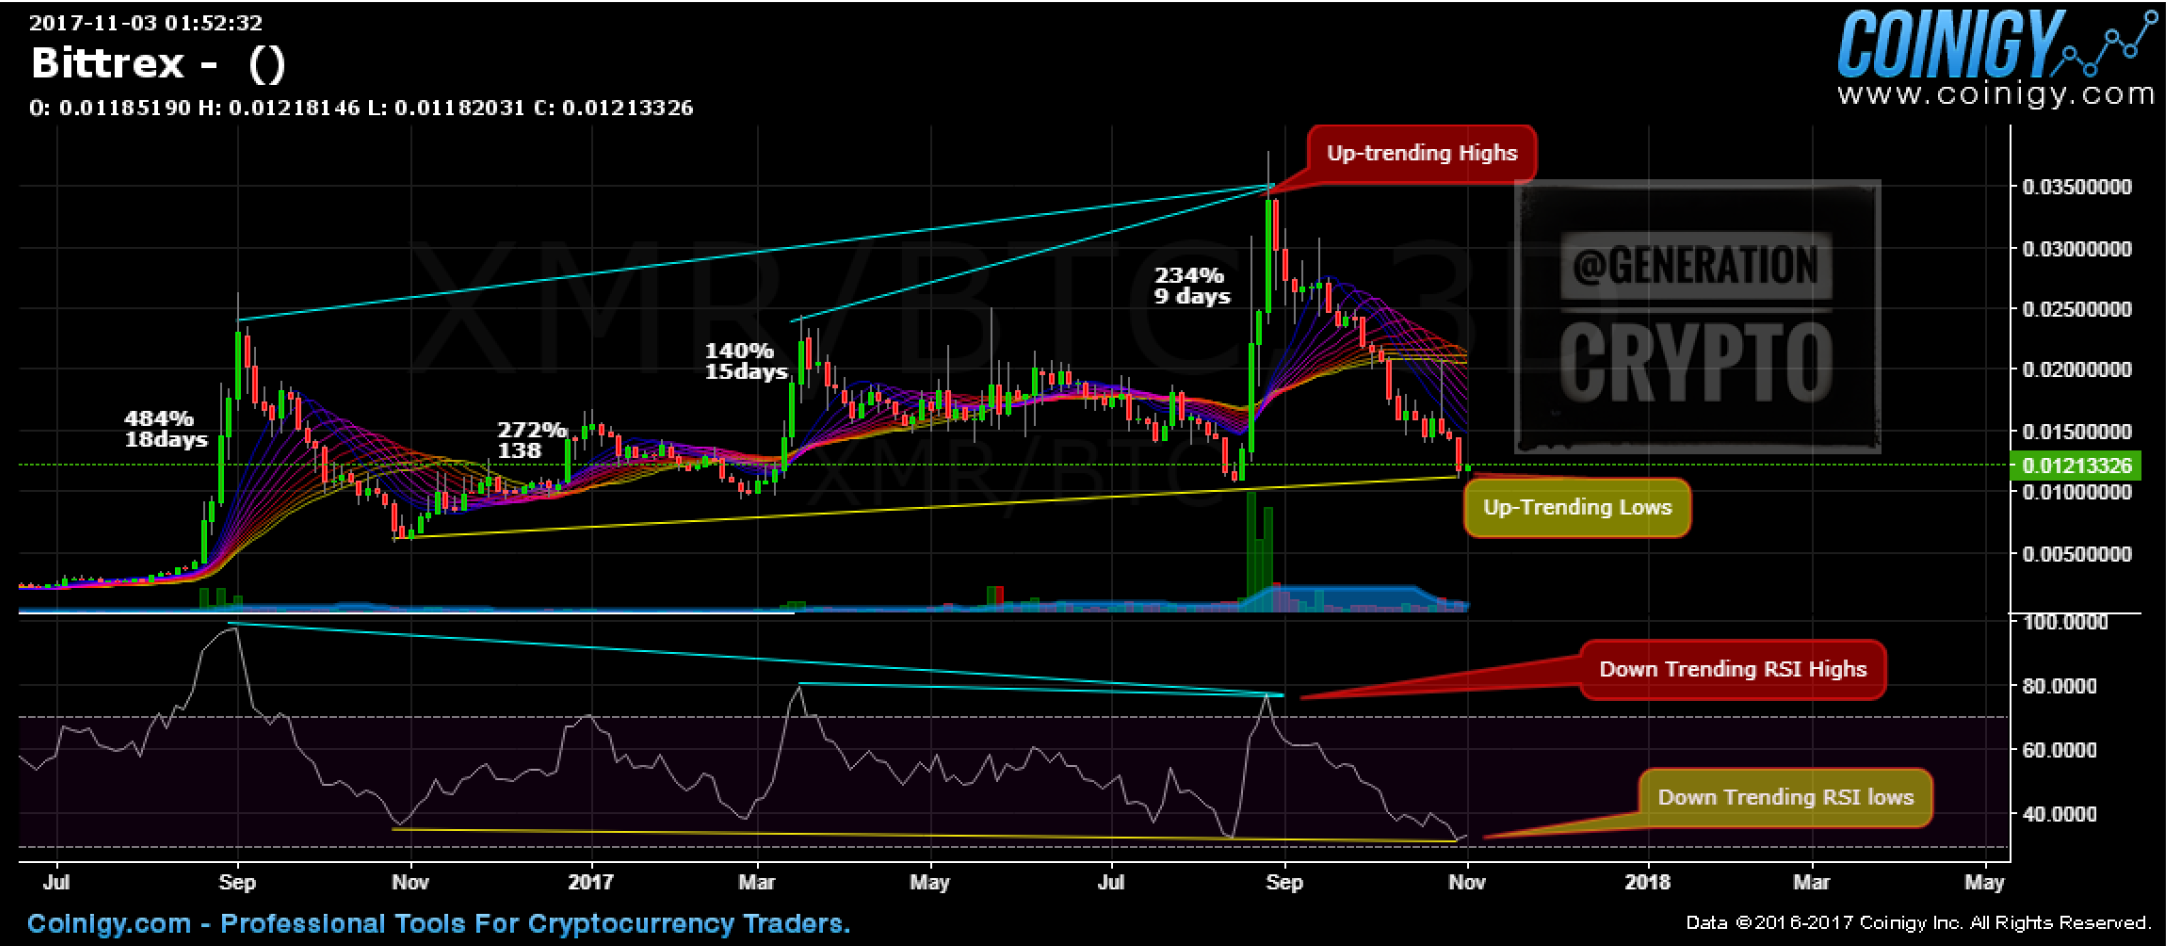
3 day chart indicates a very bullish channel. XMR is making higher highs on lower RSI highs, and higher lows on lower RSI lows; this is extremely bullish, and is most likely what is contributing to the token’s volatility.
Volatility:
Bull runs: XMR’s bull runs are very volatile.
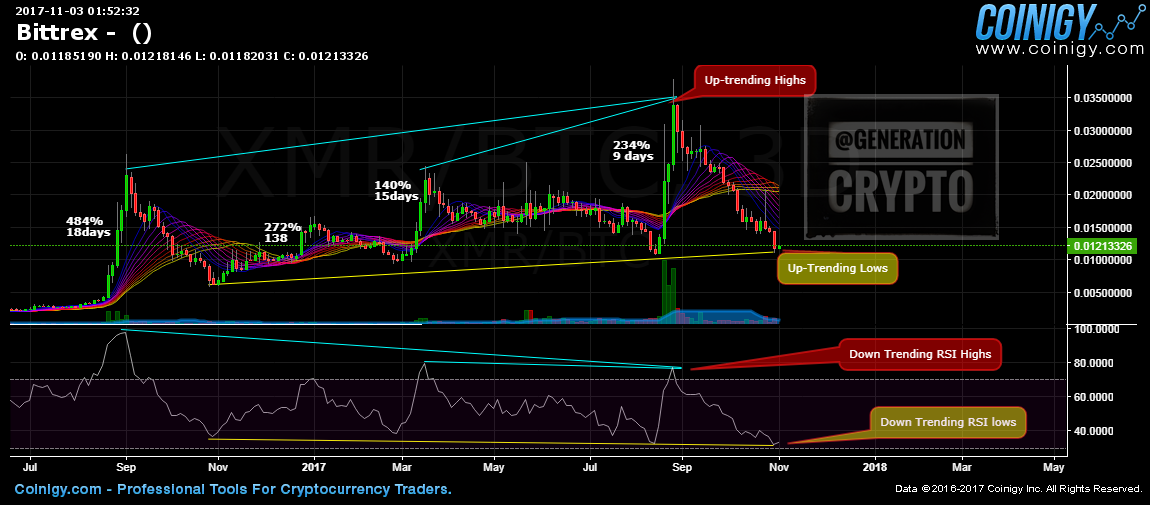
XMR’s Bull runs by number of days and percent gain, starting with most recent:
9 days, 234%
15 days, 140%
18 days, 484%
Cycles: Currently XMR appears to be at the end of a bear cycle, RSI is in the oversold range and pointing upwards.
No confirmation of a bullish reversal yet, but current bear cycle is weakening
Upcoming Reversal:
The nature of the upcoming reversal appears to be less volatile than the 3 previously highlighted bull runs.
On the first figure we observe a 278% gain over a period of 138 days. And this is most likely the type of reversal XMR will experience in the upcoming weeks**
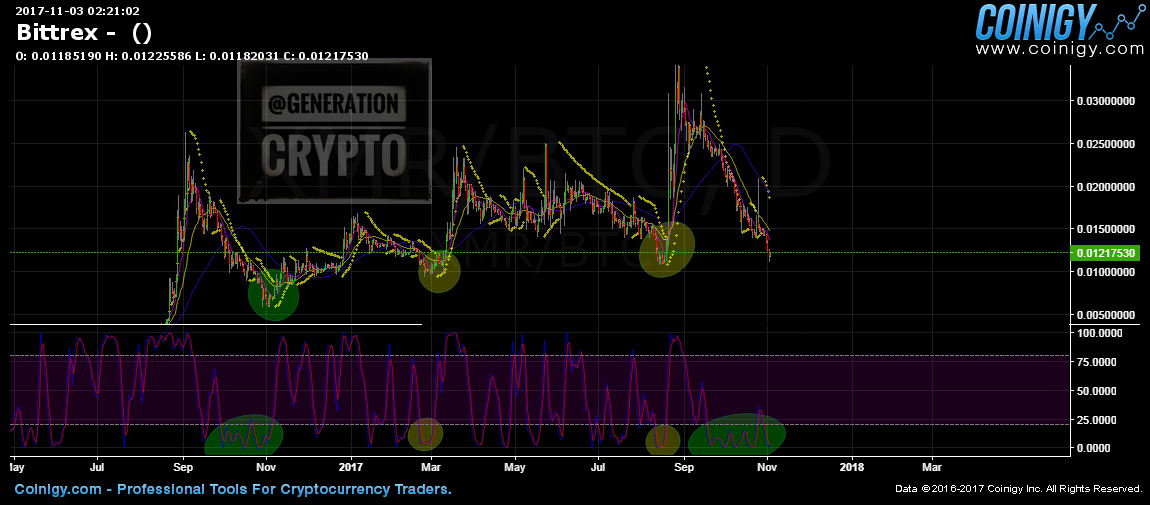
The contributing technical factor to this projection is the type of pre-reversal consolidation and how it manifests in relation to the stochastic RSI. This finding pure speculation on my part;
The above chart demonstrates XMR trend reversals, and the reversal’s corresponding stochastic RSI. Corresponding areas of interest are highlighted with corresponding colors.
The 2 highly volatile reversals demonstrated a U-shaped corresponding stochastic RSI formation. (yellow highlight)
The less volatile steady gain over a long period reversal, demonstrated a zig-zag Stochastic RSI formation. (green highlight)
Buy Signal:
Ideally, to enter a trade or an investment and maximize one’s returns while limiting liabilities and a brief ROI time. We recommend a confirmation signal before entering a position.
In XMR’s case, if we are to assume that the current bear trend is over (as figure 1 demonstrates), and a true reversal is in order. We would still recommend the following confirmation signal before entering or increasing position.
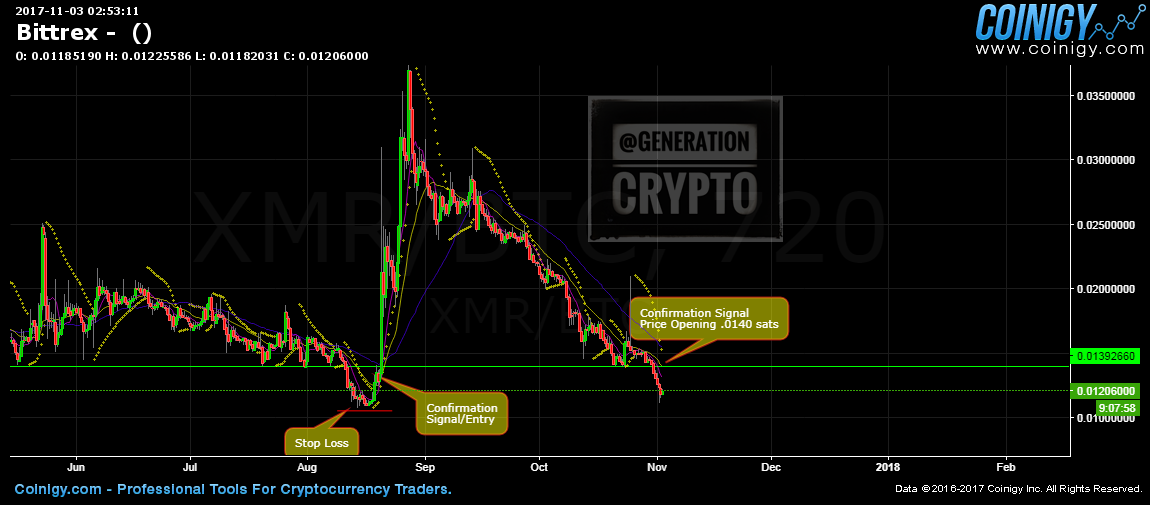
The price of XMR, to open on a 1 day chart, above .0140 Satoshis.
The following chart demonstrates our recommendation for executing the following trade in relation to previous XMR reversals.
If you would like to download this analysis, please click here.

