Bitcoin Overview
Back Into the Chop!
1.1 Hindsight, 20/20:
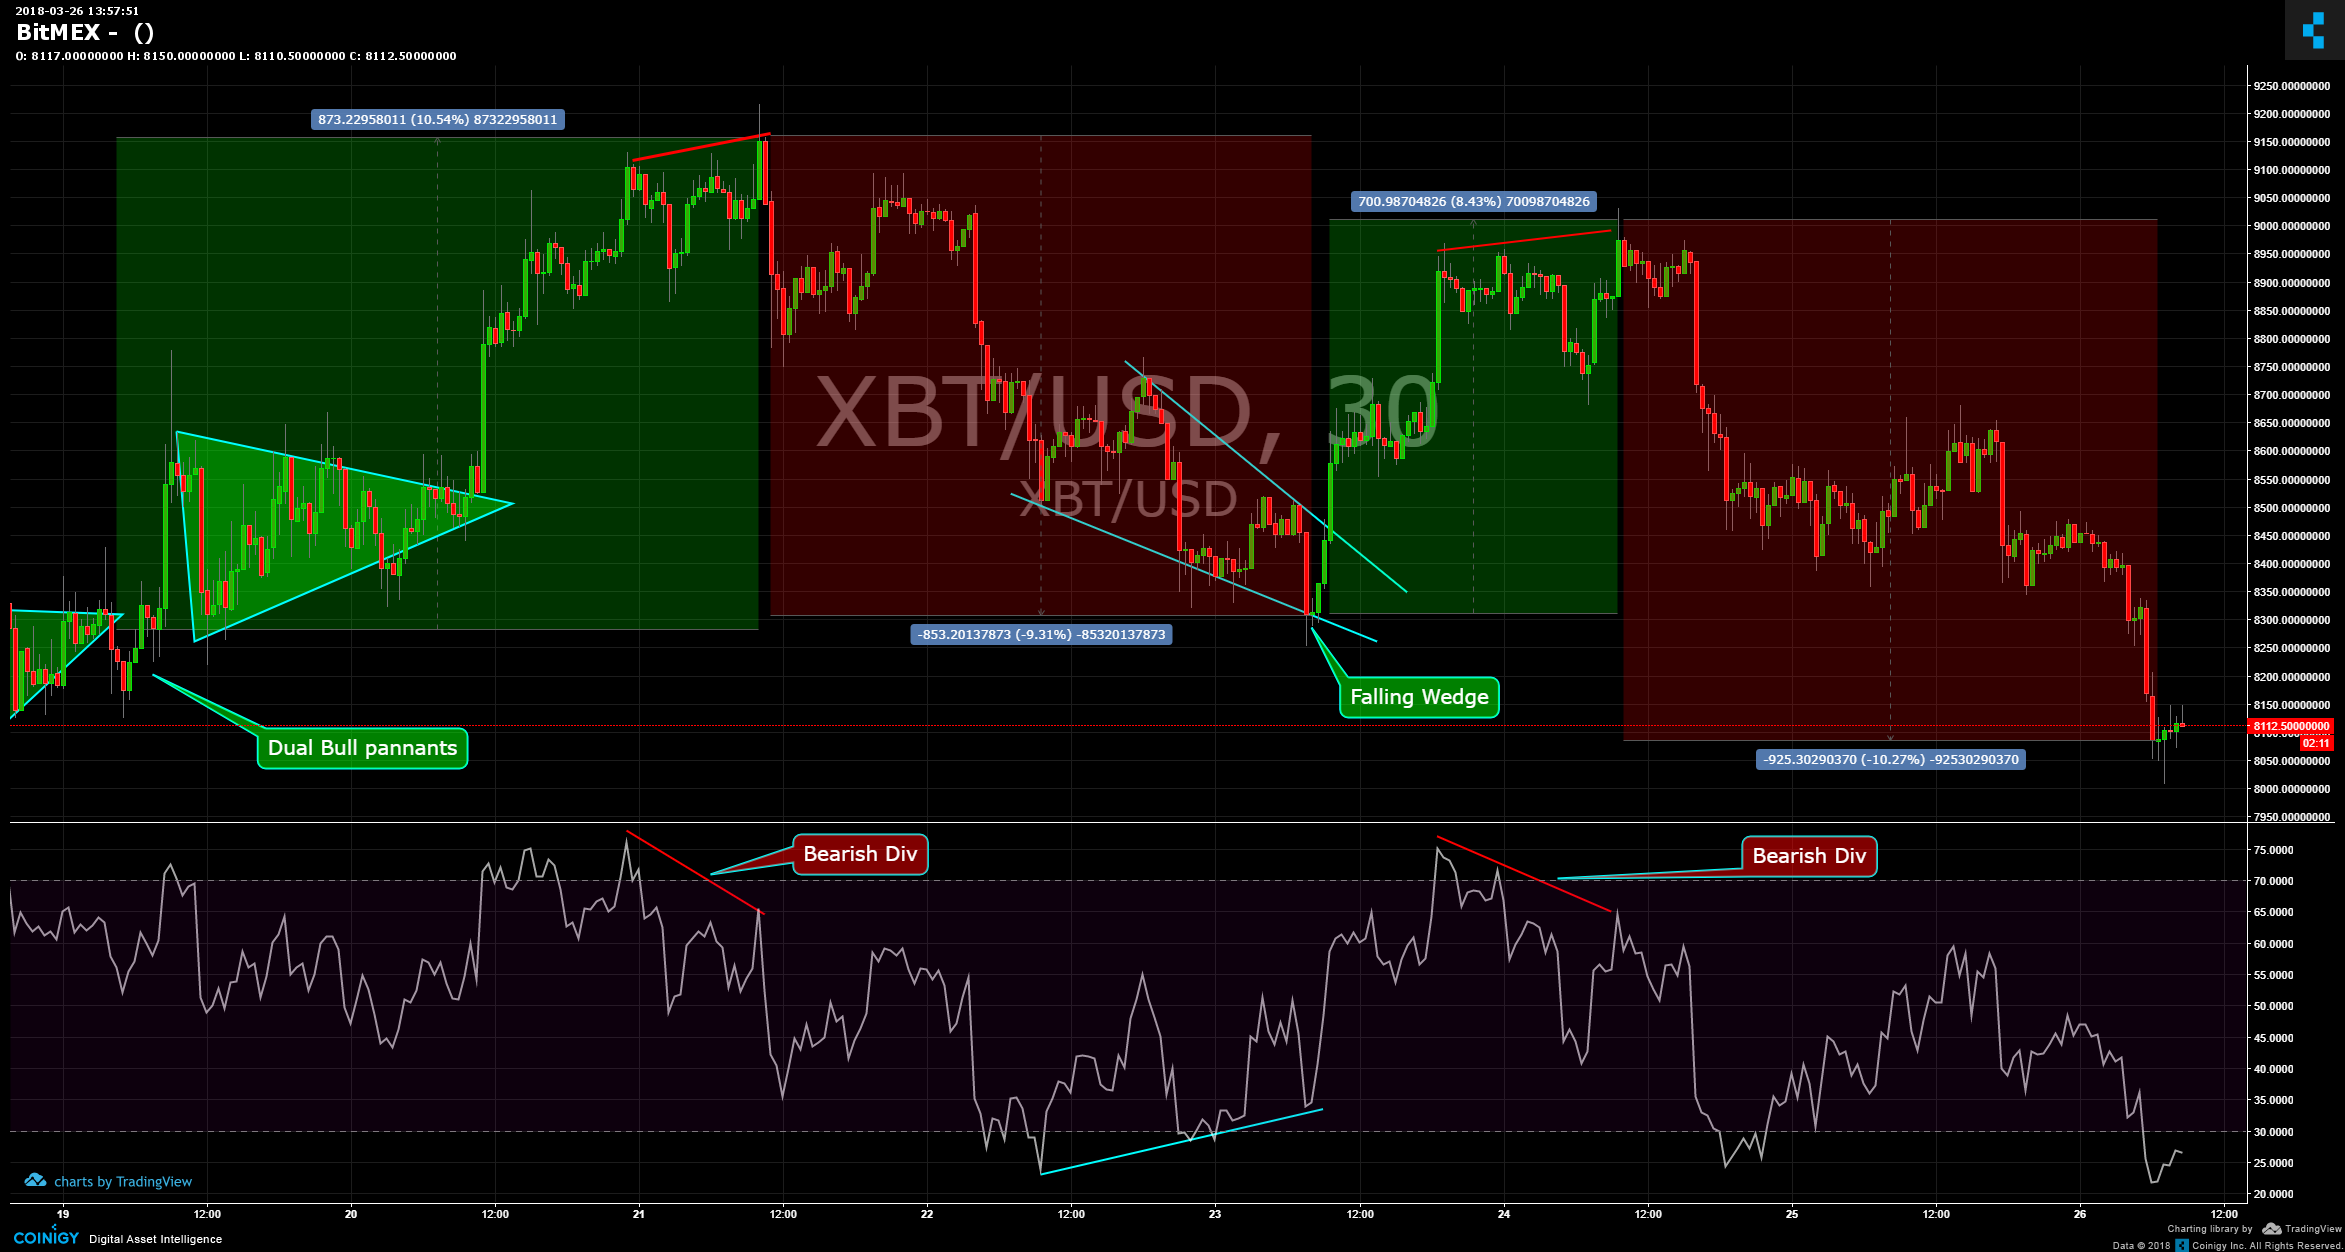
At Generation Crypto market participation is for the extraction of wealth. And volatility presents opportunity. Here’s our assessment of Bitcoin’s price action over the last 7 days. The chart below highlights the long positions in green, shorts in red, as well as the formations and divergences.
Long 1 (+10.4%): 2 bullish pennants presented themselves as buy opportunities, whether leveraged at 10x, 25x, or 50x, this buy was followed by a 10.54% rally over the next 48 hours.
The perfect entry would have been at $8,300 and this price point presented itself several times on 3/19 and 3/20.
Short 1 3/21, noon CST (-9.3%): The BTC rally was followed by a bearish divergence on RSI, with it’s peak just above $9,100. This type of divergence should prompt closure of the long position, for a sell into a short position. Following the divergence, Bitcoin took a bearish turn heading downwards to the previous long range at $8,300.
Long 2, 3/23 10:00am CST (+8.43%): The falling wedge, preached to be a reversal formation by GC admins and analysts. FW, formed over the course of 2 days, and was followed by great volatility. We published on this long entry on our Twitter; Typically at GC we like to observe the retest of the wedge, but in this scenario there was no retest. Upon breaking of this wedge the previous “Short 1” should be closed for a long entry.
Short 1 3/24, noon CST (-9.3%): Another Bearish Divergence, highlighted with the red lines on the price chart and RSI. This should prompt closure of previous long for another short sell. Bitcoin is currently at -9.3% from that divergence.
A Technical Look Into BTC
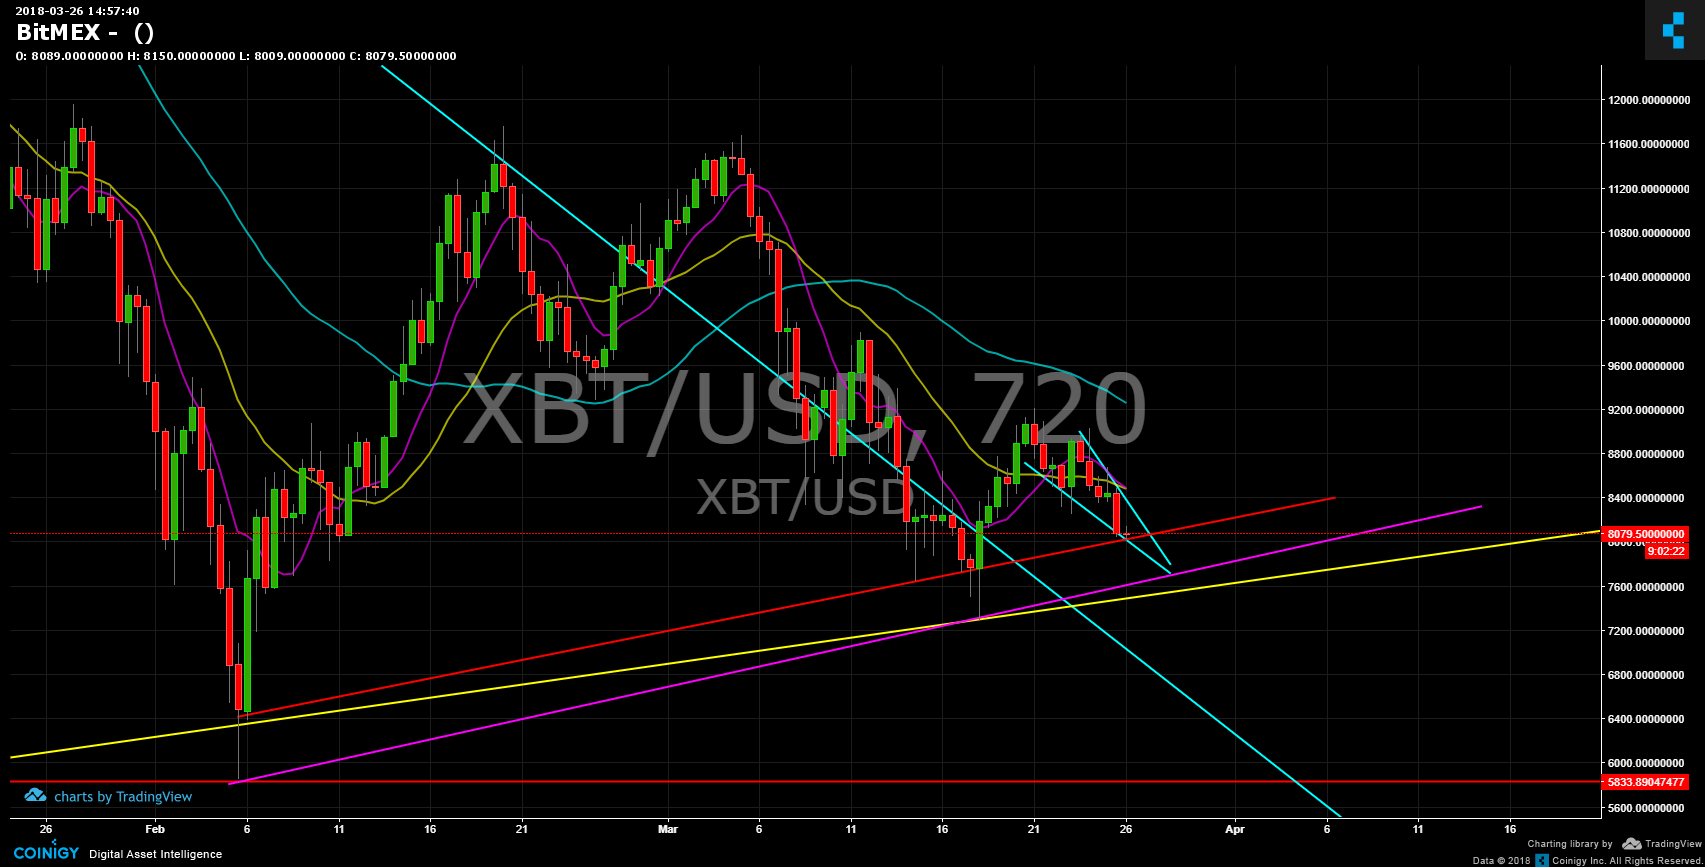
2.1 Back Into the Chop: Interim, Bitcoin is back in choppy territory. Moving averages are starting to look bearish once again. But the current price level holding above the previous downtrend resistance line is somewhat bullish.
On the chart below we highlight 3 key levels of support. The first being at $8,000 (red) Second $7.720 (purple), Third $7,500 (yellow).
Further Assessment:
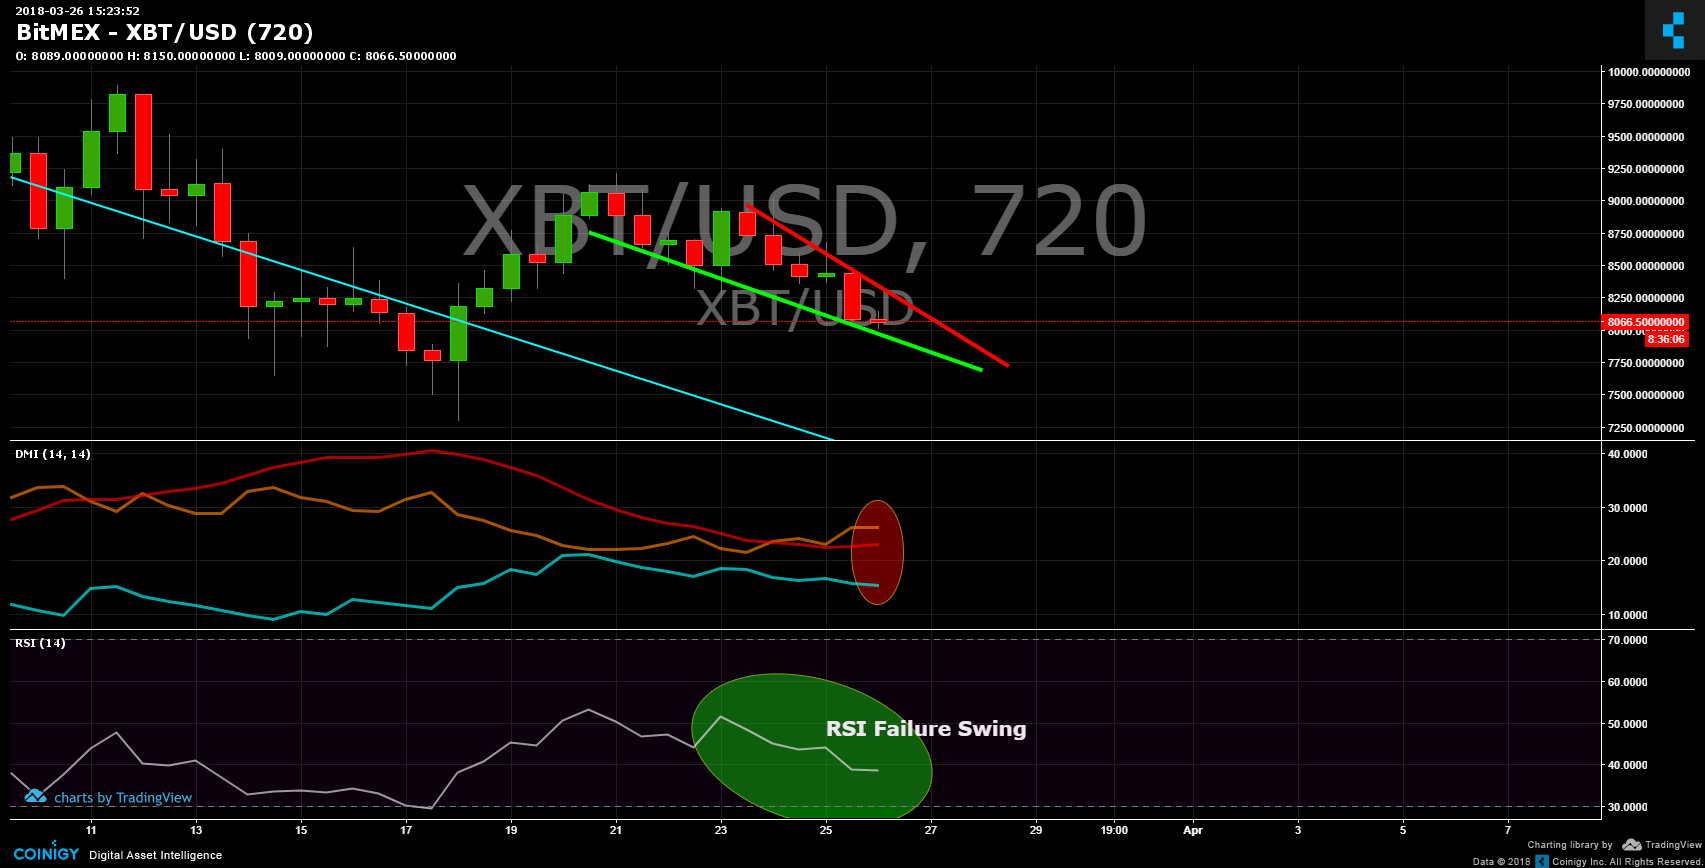
2.2 Chop Exit Scenario: Exiting the choppy territory is likely to happen at one of the above hilighted support levels. Though we do observe a falling wedge forming since the $8,800. All eyes are on this wedge, a break above this wedge would prompt a high leveraged long entry. A violation of this wedge’s support line would render it invalid.
The wedge support line is highlighted below in green, and resistance in red.
Indicator Readings:
2.3 Non-Confluence:
RSI readings are somewhat bullish with another textbook “failure swing”. Where RSI refuses to re-enter the extreme with price action relatively close to previous oversold levels.
DMI seemingly bearish, as DI- above DI+ with the Average Directional Index hovering around 23, suggesting of trend acceleration.
Hence, the chop is confirmed until we observe a clear violation of the wedge in either direction.
Navigating the Chop with GC:
3.1 At Generation Crypto, we’ve been preparing our community for the choppy market conditions and trading accordingly. From consolidating into BTC, to USD, and margin Trading BTC on leverage. We’ve experienced good hedging, solid gains, and minimal losses during this era.
More engaged community members have strived to make the most out of every market opportunity by utilizing material from our workshops.
Recent Workshops include:
Short-Long Trading BTC on Leverage. 2/27
Directional Movement Index. 3/15
Chart Formations. (Flags, Pennants, Wedges, HnS, Wedges, Diamonds) 3/16
Fibonacci Pitchfans. 3/11
Community Profits:
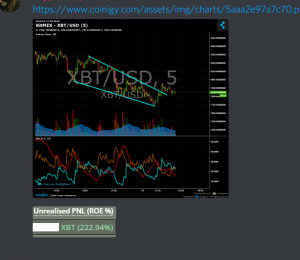
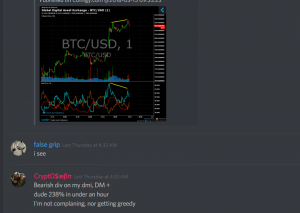
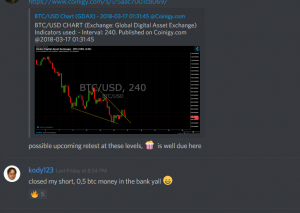
4.1 At Generation Crypto, we take pride in our community profits, as a constantly rising equity curve is the only reason to be a market participant. Here are some screen recent screen shots of our chatroom.
Several of these gains where based on community member decision making, based on workshop material.
